|
|
Document 639
Creating shaded regions in plots
Version: 5.x - Scientific WorkPlace & Scientific Notebook
Adapt this method to create shaded regions in your plots.
-
Define
 , ,
 , ,
 , ,
 ,
and ,
and
 ,
where ,
where
 on the interval
 and
and
 is a (large) positive integer.
-
Plot

-
Revise the plot so that Interval is
 and the Points Sampled is
 . .
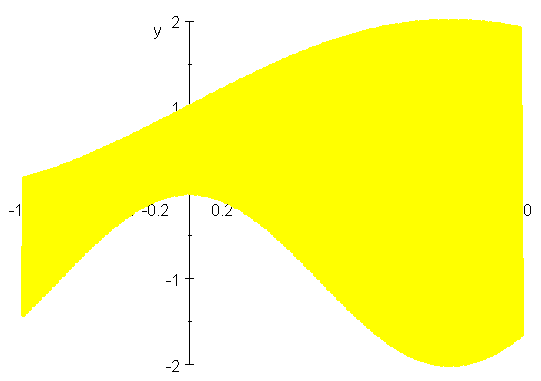
Here's an example of how well this method works:
-
From the Compute menu, choose
New Definition to create these new definitions:


-
Enter

-
From the Compute menu, choose
Plot 2D and then
choose Parametric.
-
On the Items Plotted tab, choose
Variables and Intervals.
-
Revise the plot so that Interval is
 and the Points Sampled is
 ,
and choose OK. ,
and choose OK.
-
On the Items Plotted tab, change the
Plot Color to yellow and the
Line Thickness to Thick.
-
Choose OK.
You see this plot with the shaded area.
See also 618: Shading regions in graphs.
Last revised 01/23/06
|